Monitoring EKS using CloudWatch Container Insigths 
Step-01: Introduction 
- What is CloudWatch?
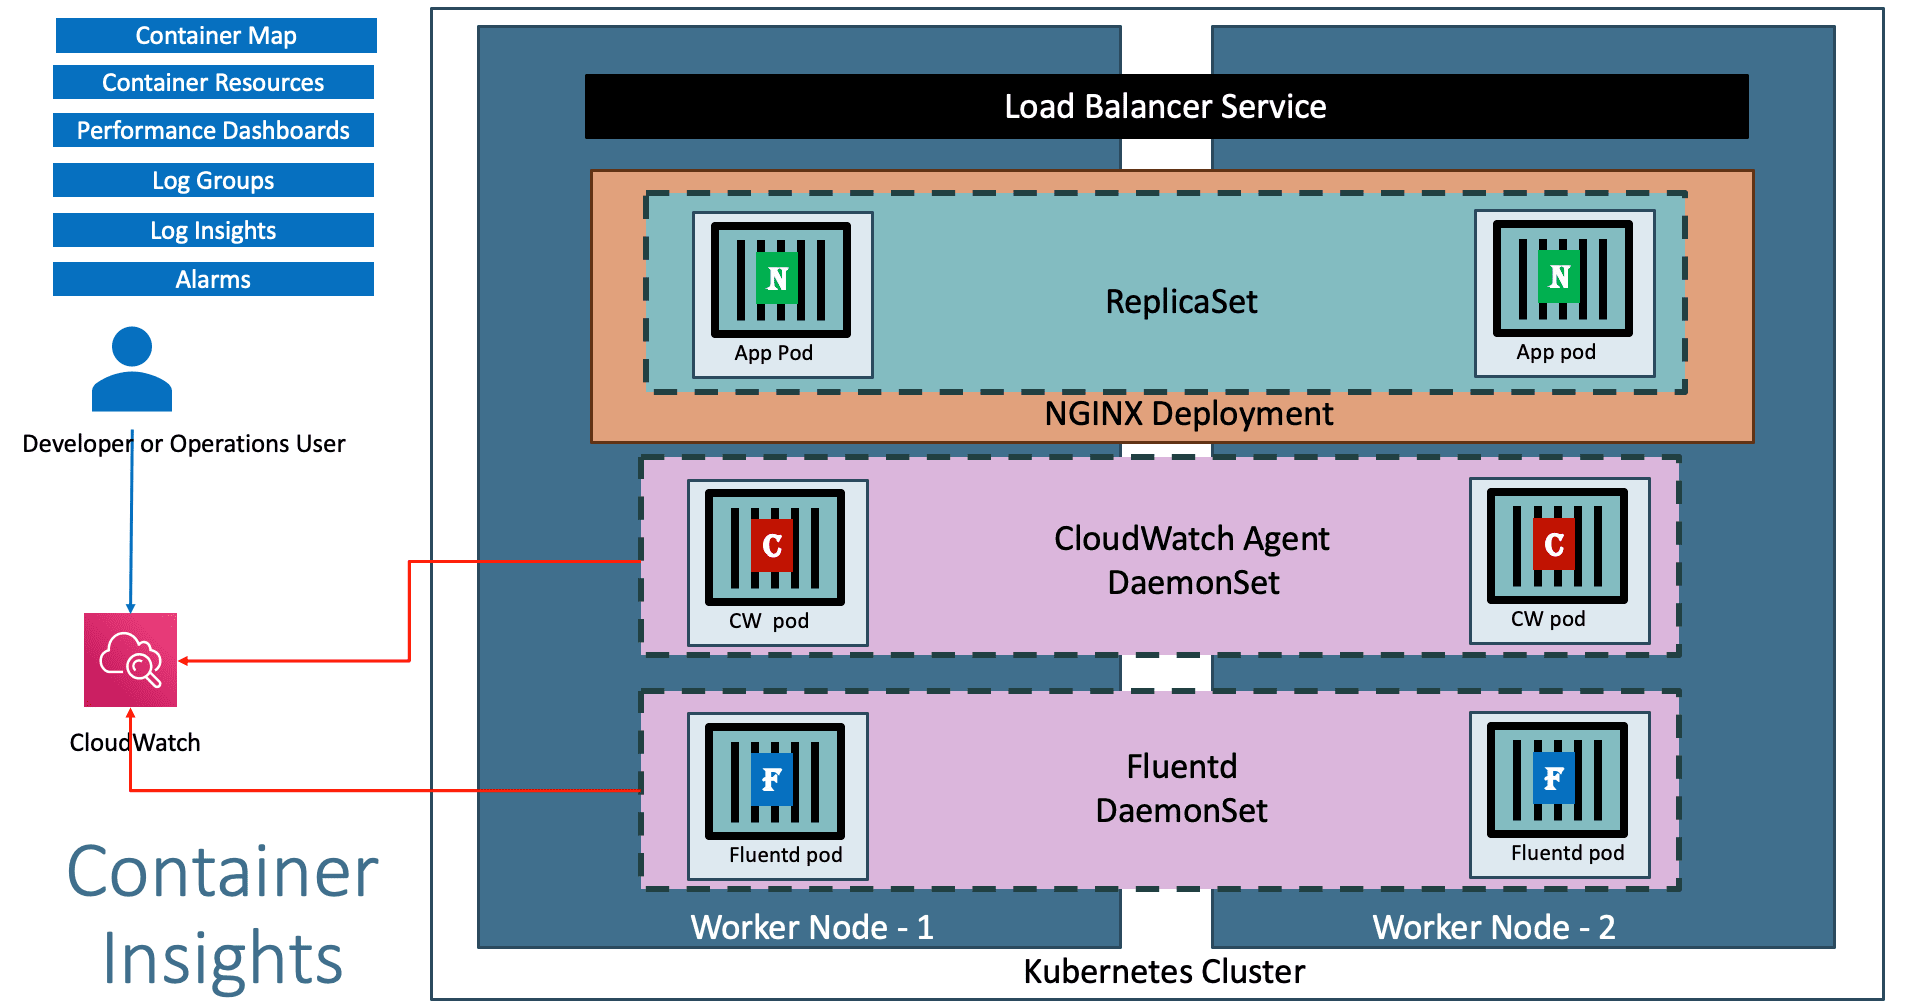
- What are CloudWatch Container Insights?
- What is CloudWatch Agent and Fluentd?
Step-02: Associate CloudWatch Policy to our EKS Worker Nodes Role 
- Go to Services -> EC2 -> Worker Node EC2 Instance -> IAM Role -> Click on that role
# Sample Role ARN
arn:aws:iam::180789647333:role/eksctl-eksdemo1-nodegroup-eksdemo-NodeInstanceRole-1FVWZ2H3TMQ2M

# Policy to be associated
Associate Policy: CloudWatchAgentServerPolicy
Step-03: Install Container Insights 
Deploy CloudWatch Agent and Fluentd as DaemonSets 
- This command will
- Creates the Namespace amazon-cloudwatch.
- Creates all the necessary security objects for both DaemonSet:
- SecurityAccount
- ClusterRole
- ClusterRoleBinding
- Deploys
Cloudwatch-Agent(responsible for sending the metrics to CloudWatch) as a DaemonSet. - Deploys fluentd (responsible for sending the logs to Cloudwatch) as a DaemonSet.
- Deploys ConfigMap configurations for both DaemonSets.
# Template
curl -s https://raw.githubusercontent.com/aws-samples/amazon-cloudwatch-container-insights/latest/k8s-deployment-manifest-templates/deployment-mode/daemonset/container-insights-monitoring/quickstart/cwagent-fluentd-quickstart.yaml | sed "s/{{cluster_name}}/<REPLACE_CLUSTER_NAME>/;s/{{region_name}}/<REPLACE-AWS_REGION>/" | kubectl apply -f -

# Replaced Cluster Name and Region
curl -s https://raw.githubusercontent.com/aws-samples/amazon-cloudwatch-container-insights/latest/k8s-deployment-manifest-templates/deployment-mode/daemonset/container-insights-monitoring/quickstart/cwagent-fluentd-quickstart.yaml | sed "s/{{cluster_name}}/eksdemo1/;s/{{region_name}}/us-east-1/" | kubectl apply -f -
Verify 
# List Daemonsets
kubectl -n amazon-cloudwatch get daemonsets
AWS EKS - Elastic Kubernetes Service - Masterclass 
Step-04: Deploy Sample Nginx Application 
Kubernetes Manifests 
apiVersion: apps/v1
kind: Deployment
metadata:
  name: sample-nginx-deployment
  labels:
    app: sample-nginx
spec:
  replicas: 1
  selector:
    matchLabels:
      app: sample-nginx
  template:
    metadata:
      labels:
        app: sample-nginx
    spec:
      containers:
        - name: sample-nginx
          image: stacksimplify/kubenginx:1.0.0
          ports:
            - containerPort: 80
          resources:
            requests:
              cpu: "5m"
              memory: "5Mi"
            limits:
              cpu: "10m"
              memory: "10Mi"
---
apiVersion: v1
kind: Service
metadata:
  name: sample-nginx-service
  labels:
    app: sample-nginx
spec:
  selector:
    app: sample-nginx
  ports:
  - port: 80
    targetPort: 80
Deploy 
# Deploy
kubectl apply -f kube-manifests
Step-05: Generate load on our Sample Nginx Application 
# Generate Load
kubectl run --generator=run-pod/v1 apache-bench -i --tty --rm --image=httpd -- ab -n 500000 -c 1000 http://sample-nginx-service.default.svc.cluster.local/
Step-06: Access CloudWatch Dashboard 
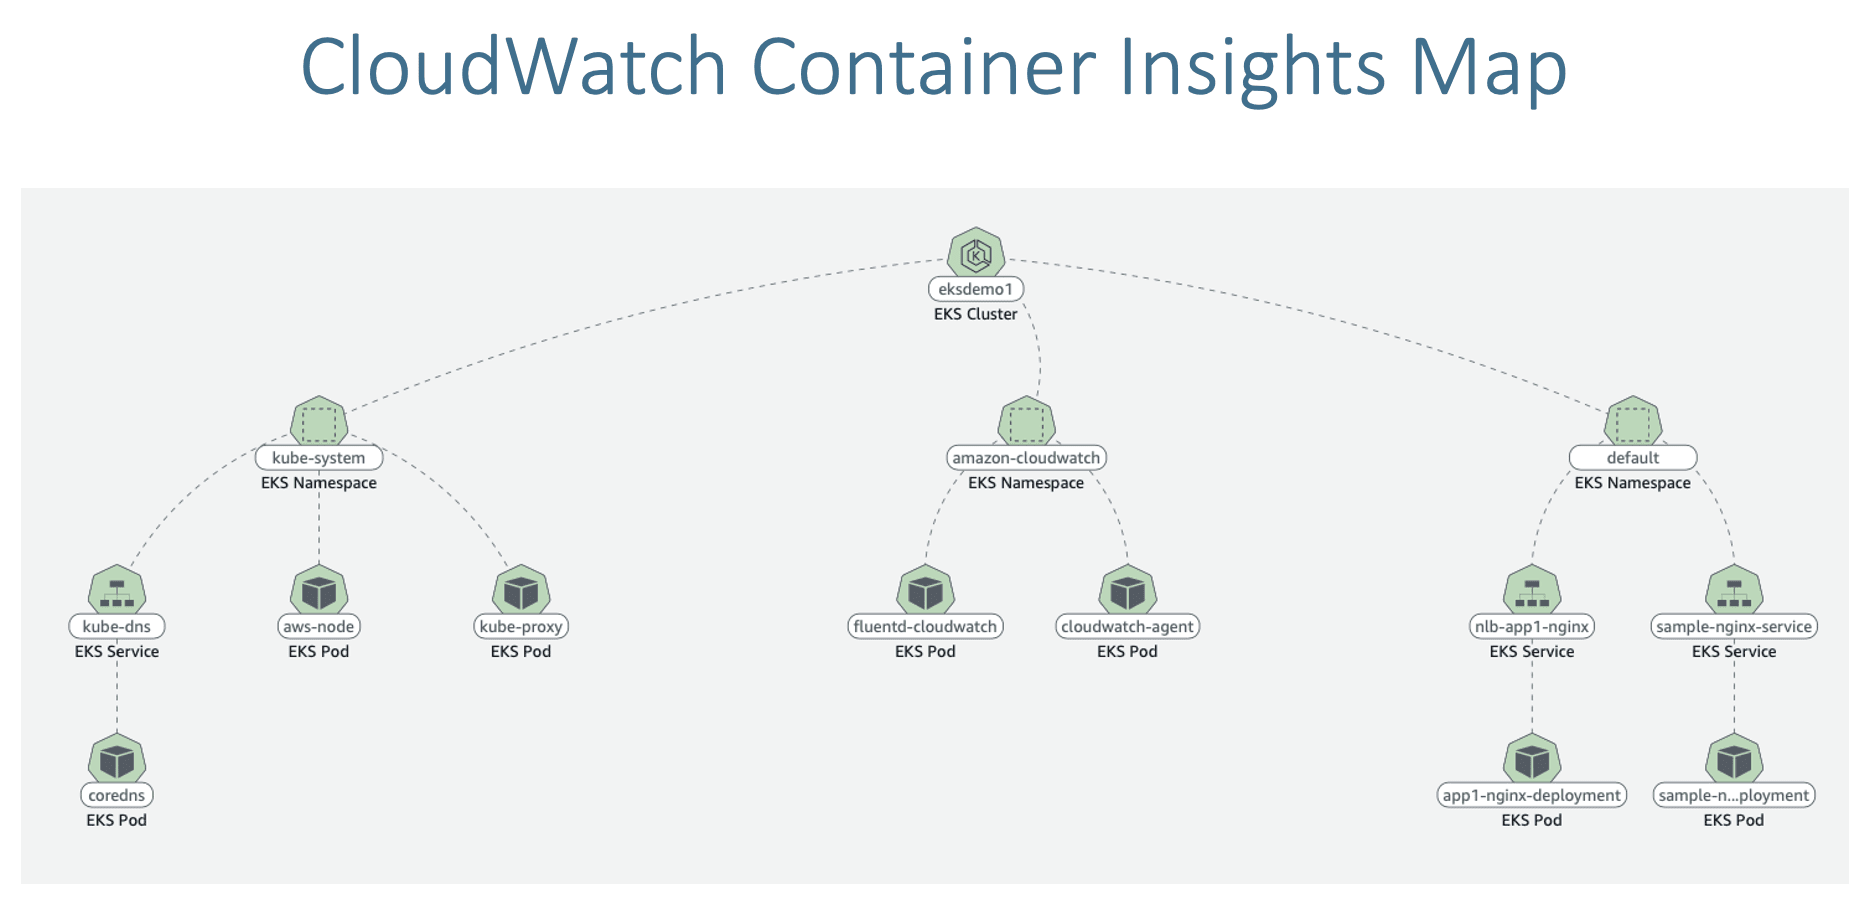
- Access CloudWatch Container Insigths Dashboard
Step-07: CloudWatch Log Insights 
- View Container logs
- View Container Performance Logs
Step-08: Container Insights - Log Insights in depth 
- Log Groups
- Log Insights
- Create Dashboard
Create Graph for Avg Node CPU Utlization 
- DashBoard Name: EKS-Performance
- Widget Type: Bar
- Log Group: /aws/containerinsights/eksdemo1/performance
STATS avg(node_cpu_utilization) as avg_node_cpu_utilization by NodeName
| SORT avg_node_cpu_utilization DESC
Container Restarts 
- DashBoard Name: EKS-Performance
- Widget Type: Table
- Log Group: /aws/containerinsights/eksdemo1/performance
STATS avg(number_of_container_restarts) as avg_number_of_container_restarts by PodName
| SORT avg_number_of_container_restarts DESC
Cluster Node Failures 
- DashBoard Name: EKS-Performance
- Widget Type: Table
- Log Group: /aws/containerinsights/eksdemo1/performance
stats avg(cluster_failed_node_count) as CountOfNodeFailures
| filter Type="Cluster"
| sort @timestamp desc
CPU Usage By Container 
- DashBoard Name: EKS-Performance
- Widget Type: Bar
- Log Group: /aws/containerinsights/eksdemo1/performance
stats pct(container_cpu_usage_total, 50) as CPUPercMedian by kubernetes.container_name
| filter Type="Container"
Pods Requested vs Pods Running 
- DashBoard Name: EKS-Performance
- Widget Type: Bar
- Log Group: /aws/containerinsights/eksdemo1/performance
fields @timestamp, @message
| sort @timestamp desc
| filter Type="Pod"
| stats min(pod_number_of_containers) as requested, min(pod_number_of_running_containers) as running, ceil(avg(pod_number_of_containers-pod_number_of_running_containers)) as pods_missing by kubernetes.pod_name
| sort pods_missing desc
Application log errors by container name 
- DashBoard Name: EKS-Performance
- Widget Type: Bar
-
Log Group: /aws/containerinsights/eksdemo1/application
stats count() as countoferrors by kubernetes.container_name | filter stream="stderr" | sort countoferrors desc -
Reference: https://docs.aws.amazon.com/AmazonCloudWatch/latest/monitoring/Container-Insights-view-metrics.html
Step-09: Container Insights - CloudWatch Alarms 
Create Alarms - Node CPU Usage 
- Specify metric and conditions
- Select Metric: Container Insights -> ClusterName -> node_cpu_utilization
- Metric Name: eksdemo1_node_cpu_utilization
- Threshold Value: 4
- Important Note: Anything above 4% of CPU it will send a notification email, ideally it should 80% or 90% CPU but we are giving 4% CPU just for load simulation testing
- Configure Actions
- Create New Topic: eks-alerts
- Email: dkalyanreddy@gmail.com
- Click on Create Topic
- Important Note:** Complete Email subscription sent to your email id.
- Add name and description
- Name: EKS-Nodes-CPU-Alert
- Descritption: EKS Nodes CPU alert notification
- Click Next
- Preview
- Preview and Create Alarm
- Add Alarm to our custom Dashboard
- Generate Load & Verify Alarm
# Generate Load
kubectl run --generator=run-pod/v1 apache-bench -i --tty --rm --image=httpd -- ab -n 500000 -c 1000 http://sample-nginx-service.default.svc.cluster.local/
Step-10: Clean-Up Container Insights 
# Template
curl https://raw.githubusercontent.com/aws-samples/amazon-cloudwatch-container-insights/latest/k8s-deployment-manifest-templates/deployment-mode/daemonset/container-insights-monitoring/quickstart/cwagent-fluentd-quickstart.yaml | sed "s/{{cluster_name}}/cluster-name/;s/{{region_name}}/cluster-region/" | kubectl delete -f -

# Replace Cluster Name & Region Name
curl https://raw.githubusercontent.com/aws-samples/amazon-cloudwatch-container-insights/latest/k8s-deployment-manifest-templates/deployment-mode/daemonset/container-insights-monitoring/quickstart/cwagent-fluentd-quickstart.yaml | sed "s/{{cluster_name}}/eksdemo1/;s/{{region_name}}/us-east-1/" | kubectl delete -f -
Step-11: Clean-Up Application 
# Delete Apps
kubectl delete -f  kube-manifests/
References 
- https://docs.aws.amazon.com/AmazonCloudWatch/latest/monitoring/deploy-container-insights-EKS.html
- https://docs.aws.amazon.com/AmazonCloudWatch/latest/monitoring/ContainerInsights-Prometheus-Setup.html
- https://docs.aws.amazon.com/AmazonCloudWatch/latest/monitoring/Container-Insights-reference-performance-entries-EKS.html


